~ This post is only available in English ~
Current global scale land-change models used for integrated assessments and climate modeling are based on classifications of land cover, often using a resolution of 0.5 degree (approximately 50 x 50 km at the equator). To improve such assessments we have developed a new global representation of land cover and land use, at 5 arcminute resolution (9.25 x 9.25 km in equal area projection Eckert IV, as is used here). The new Land System classification represents land cover and land use in mosaic landscapes with different land-use management intensity and livestock composition, which are important aspects of the land system.
We have also tested if global assessments can be based on globally uniform allocation rules. Logistic regressions were used to analyze variation in spatial determinants of Land Systems. This analysis indicates strong associations between Land Systems and a range of socioeconomic and biophysical indicators of human-environment interactions. The set of identified spatial determinants of a Land System differs among regions and scales, especially for (mosaic) cropland systems, grassland systems with livestock, and settlements. (Semi-)Natural LS have more similar spatial determinants across regions and scales.
Using Land Systems in global models is expected to result in a more accurate representation of land use capturing important aspects of land systems and land architecture: the variation in land cover and the link between land-use intensity and livestock composition. Because the set of most important spatial determinants of LS varies among regions and scales, land-change models that include the human drivers of land change are best parameterized at sub-global level, where similar biophysical, socioeconomic and cultural conditions prevail in the specific regions.
Het hoofdbestand is land_systems.asc en heeft een Eckert IV equal area projectie met een resolutie van 9.25 x 9.25 km (overeenkomend met 5 arcminutes). Zowel de land_systems.asc en de land_systems_legend.lyr kunnen geopend worden in ArcGIS Pro. Door de legenda aan de kaart te verbinden, kan onderstaande kaart verkregen worden.
– Institute for Environmental Studies, VU University Amsterdam, The Netherlands
Sanneke van Asselen
VU Amsterdam
Peter H. Verburg
VU Amsterdam
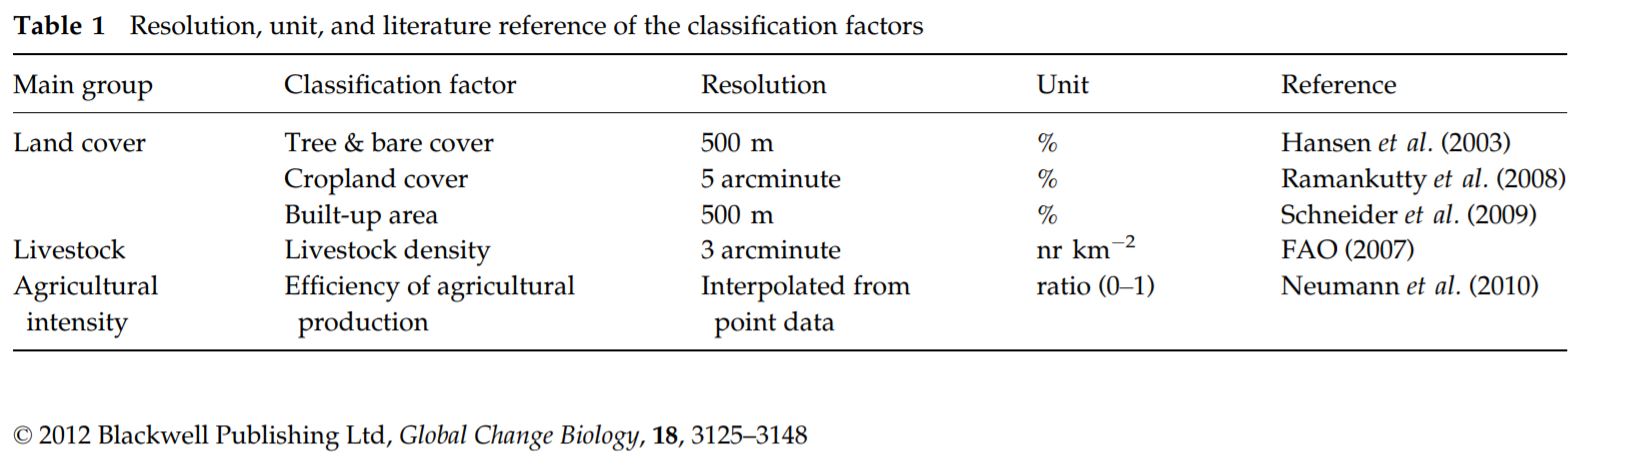
The LS classification is based on three main classification factors: land cover, livestock, and agricultural intensity. Variables used to represent land cover are tree cover (%), bare soil cover (%), cropland cover (%), and built-up area (%). These variables characterize important components of land cover patterns but do not necessarily add up to 100%.
- For tree and bare soil cover the MODIS Vegetation Continuous Field dataset was used (Hansen et al., 2003).
- The built-up area map is based on MODIS 500 m satellite data (Schneider et al., 2009).
- Cropland cover is derived from the global dataset of croplands in the year 2000 developed by Ramankutty et al. (2008).
- Livestock data are obtained from the Gridded Livestock of the World information system (FAO, 2007).
- As an indicator for the intensity of land use global maps of the efficiency of agricultural production are used (Neumann et al., 2010). These maps are constructed based on stochastic frontier production functions, which represent the maximum yield given environmental conditions.
See this image for an overview of the datafiles used in this study.
Bij gebruik van de data refereert u naar:
Van Asselen, S., Verburg, P.H. (2012) A Land System representation for global assessments and land-use modeling. Global Change Biology. http://dx.doi.org/10.1111/j.1365-2486.2012.02759.x.